Applies to Pivot version 2.2.
*You are viewing an archived guide. Please click this link for an updated guide.*
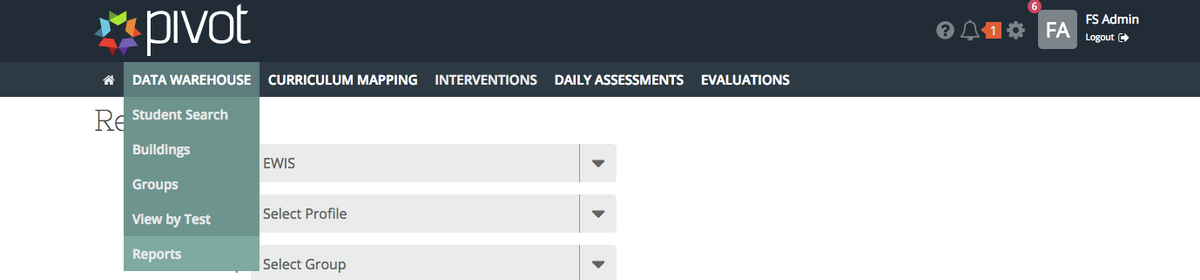
Hover over Data Warehouse and select Reports.
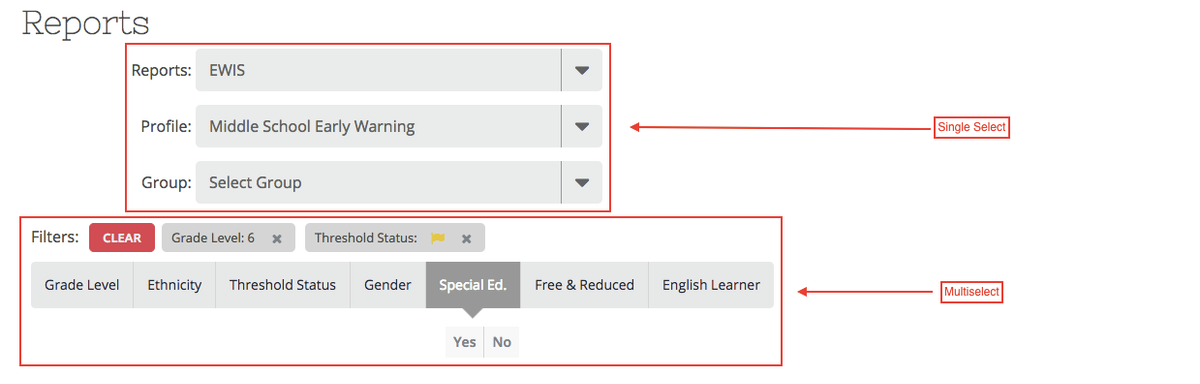
Select filter(s).
- Select a report.
- At this time, only EWIS is available.
- Select a profile.
- Some districts have one profile available, while others have three or more. Consult with your district leadership if you have questions.
- Select a group (optional).
- Select grade level(s) (optional).
- Select ethnicity (optional).
- Select threshold status (e.g., yellow flag, red flag) (optional).
- A yellow flag indicates a student has crossed one early warning indicator threshold established by your district.
- A red flag indicates a student has crossed two or more early warning indicator thresholds establish by your district.
- Select gender (optional).
- Select special education status (optional).
- Select free and reduced lunch status (optional).
- Select English learn classification status (optional).
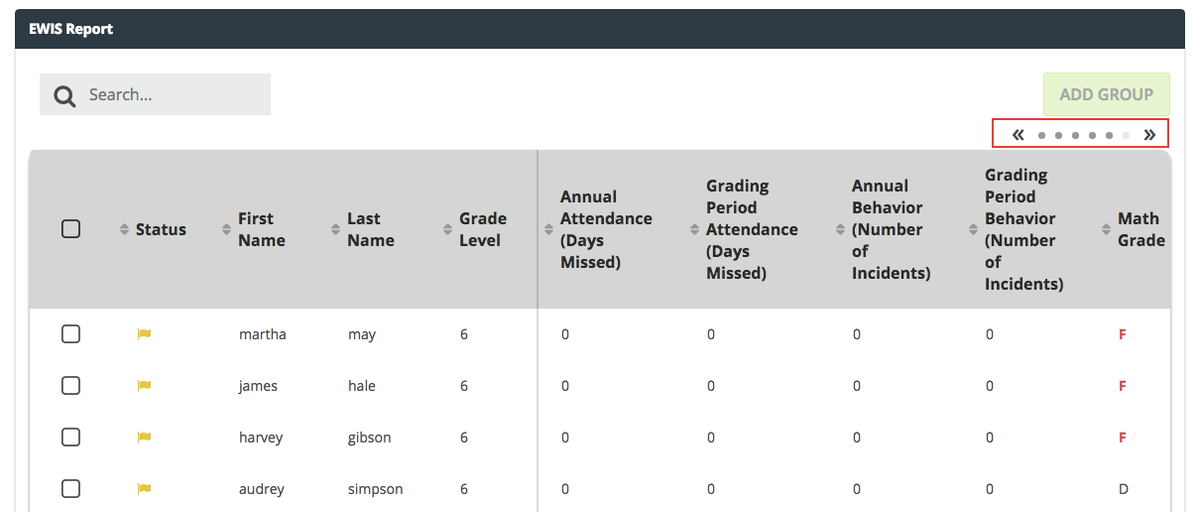
View results.
- Each column is sortable (e.g., alphabetically, ascending/descending).
- Please note the arrows at the top right of the table. These allow you to navigate to additional data fields.
- Any indicators that contribute to a yellow or red flag will be displayed in red.