[ARCHIVE] View ISTEP+ Results - Super & Admin
*You are viewing an archived guide. Please click this link for an updated guide.*
Applies to Pivot version 2.2.
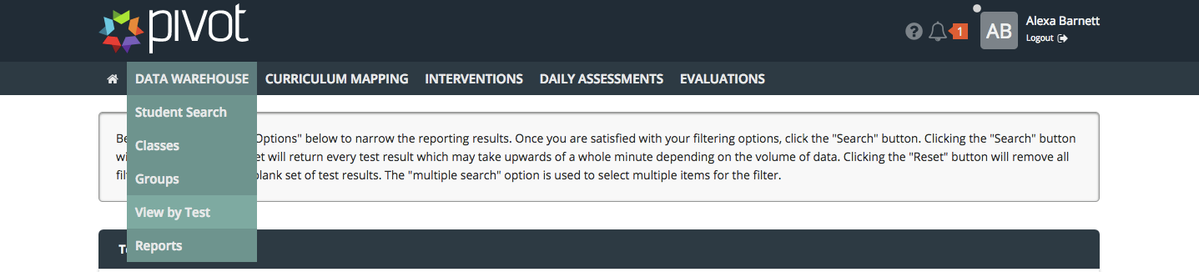
Hover over Data Warehouse and select View by Test.
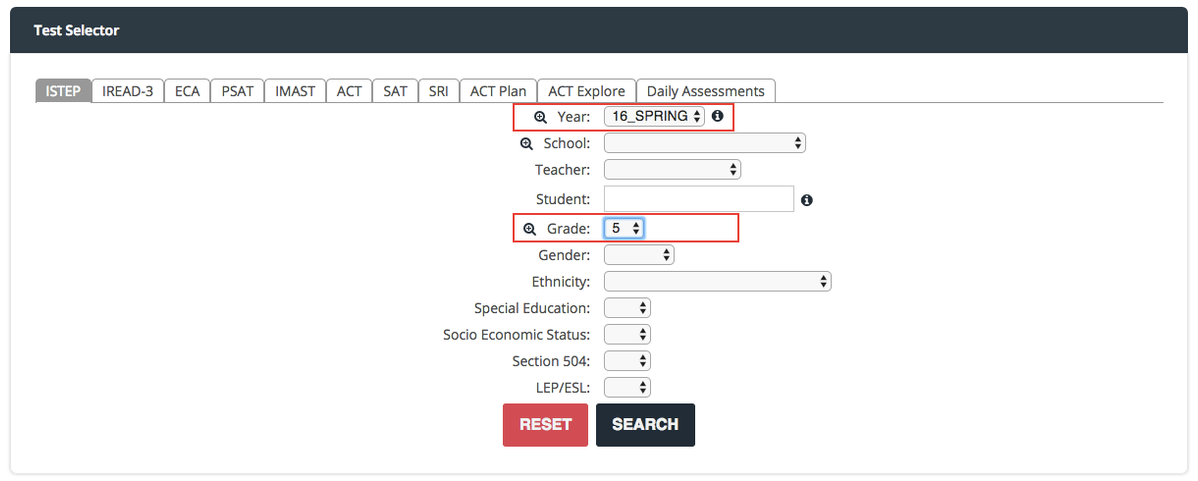
Select the target school year.
Select school (optional).
Select a teacher (optional).
- Due to the way teacher rosters are reported by Pearson, we strongly recommend not attempting to select a teacher from this filter.
Search for a student (optional).
Search by grade level (optional).
- Since super and admin users have much more data available to them, we recommend selecting a grade level to limit your results.
Search by gender (optional).
Search by ethnicity (optional).
Search by special education status (optional).
Search by socioeconomic status (optional).
Search by 504 Plan status (optional).
Search by language proficiency status (optional).
Click Search.
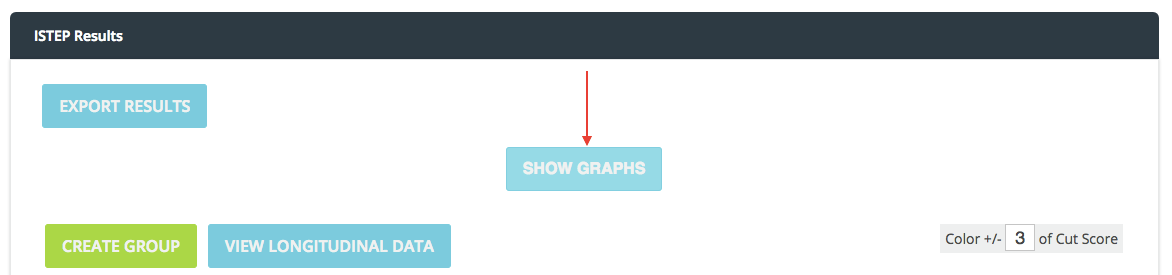
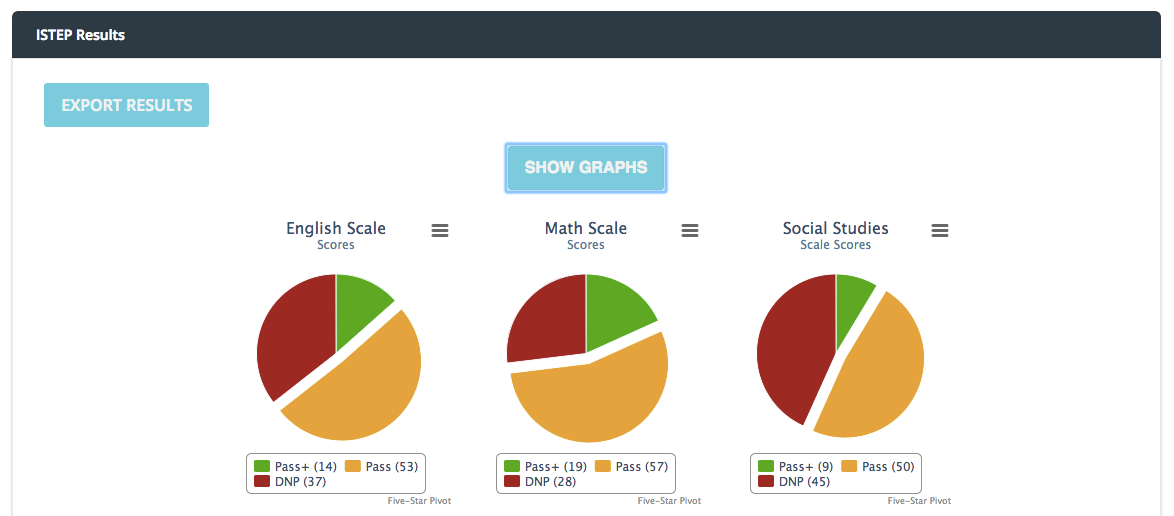
Click Show Graphs.
View graphs.
- Red = Did Not Pass
- Orange = Pass
- Green = Pass+
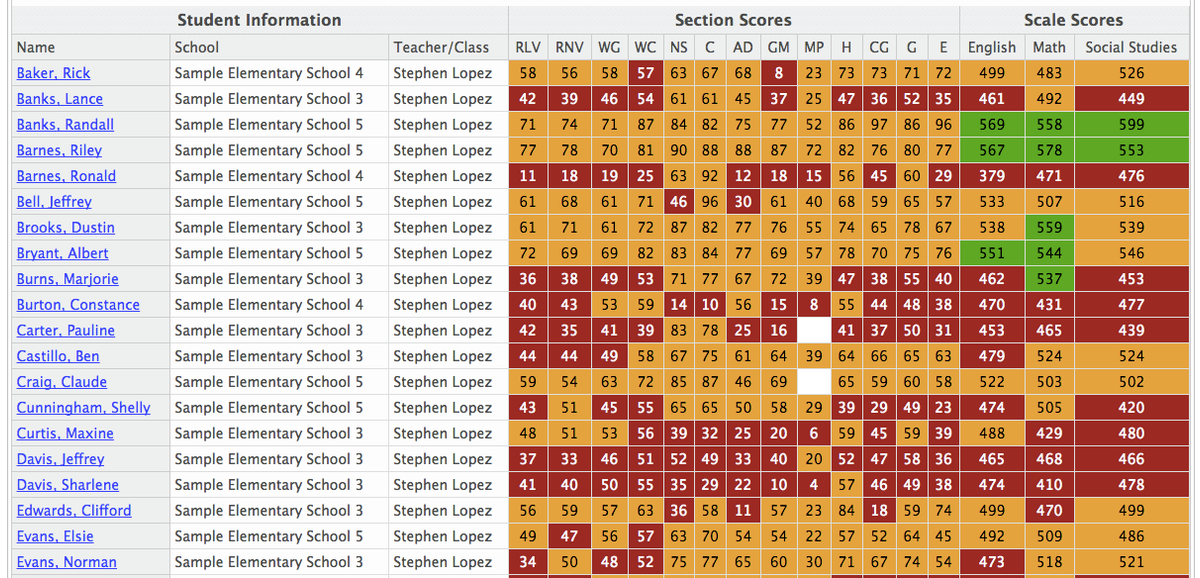
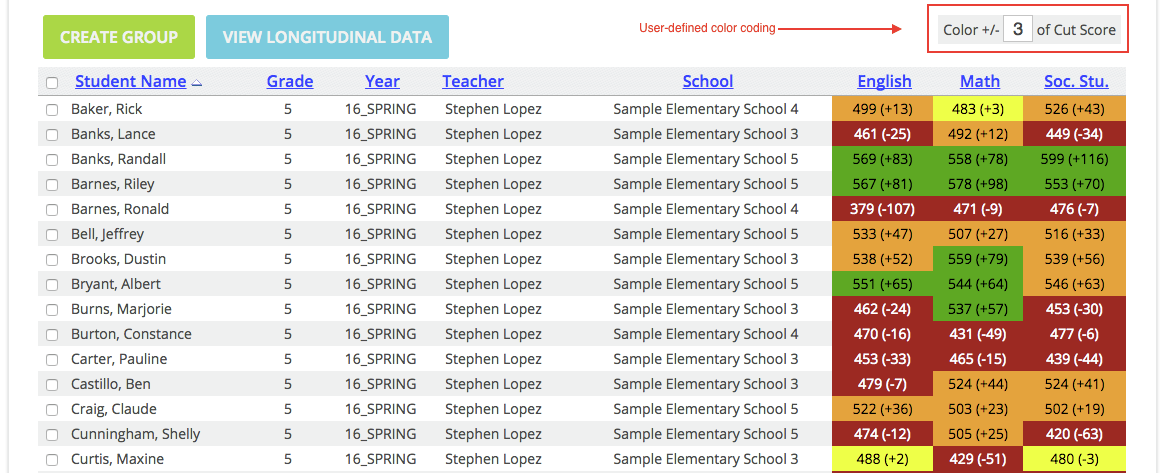
View student results.
- Initially, results are sorted alphabetically.
- Each column can be sorted ascending or descending.
- The user-defined color coding field allows you to choose which cells to shade yellow. This color identifies students on the "bubble," just above or below passing.
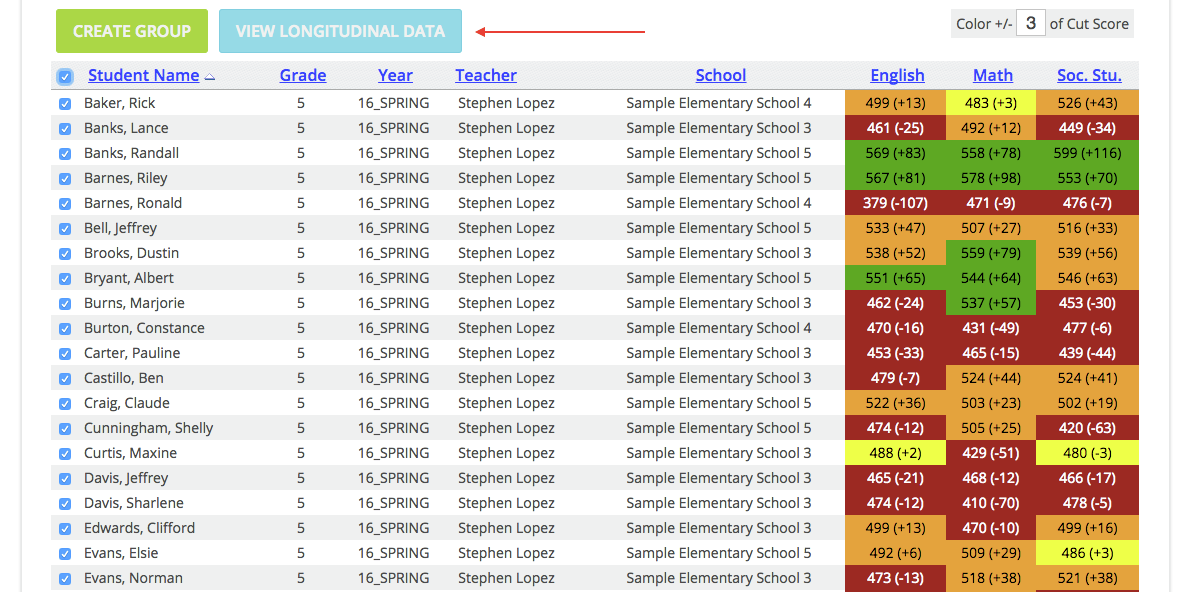
Select one or more students and click View Longitudinal Data.
View summary of results for selected student(s).
Then, click the ISTEP tab.
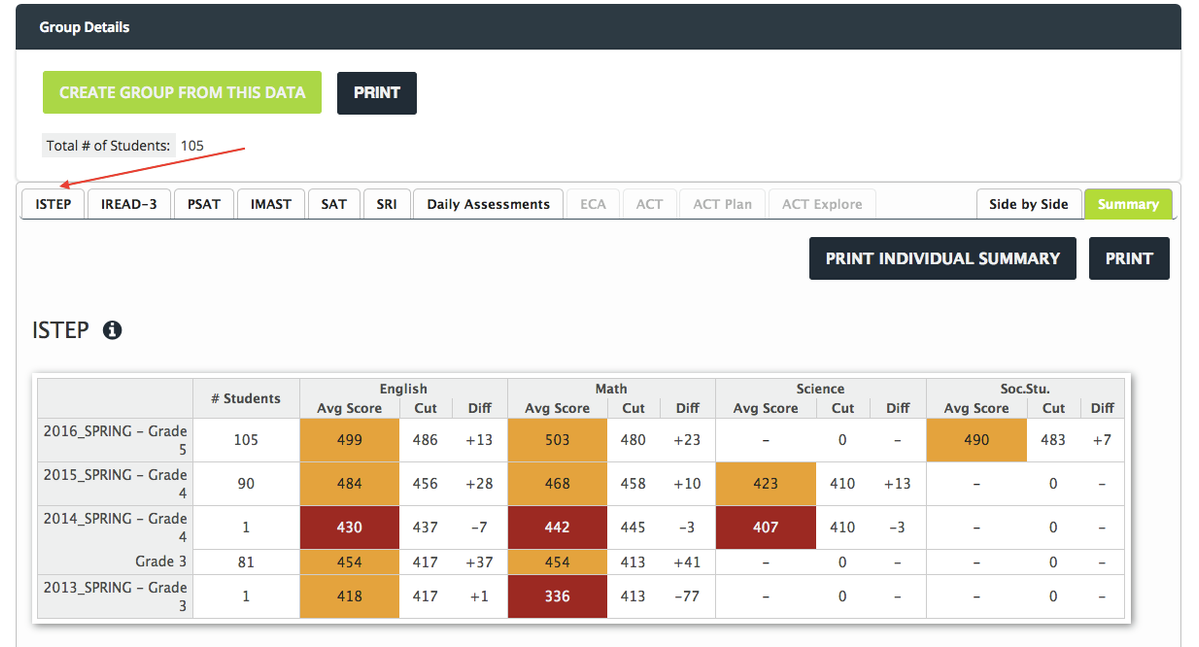
Find the most recent grade level and school year.
Click Show Student Breakdown.
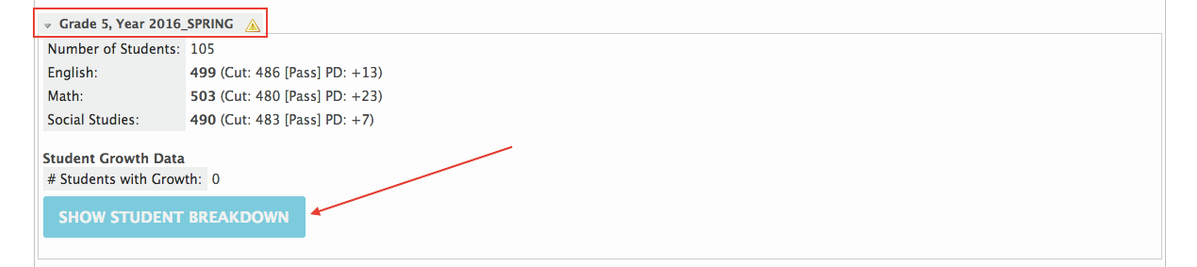
View students' subscore results.
- Hover over a column header's abbreviation to see the full description (e.g., AD = Algebraic Thinking and Data Analysis).
- Hover over a cell to see how many scale score points above or below the cut score each student earned.